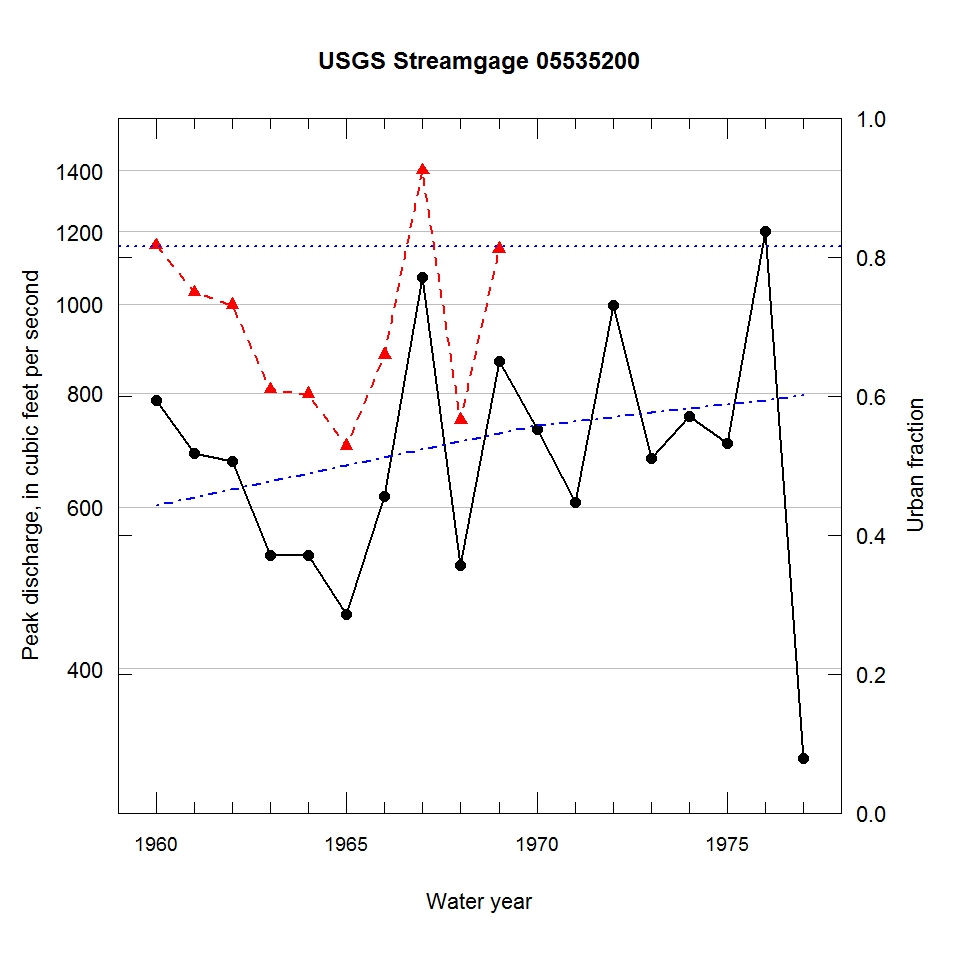
Observed and urbanization-adjusted annual maximum peak discharge and associated urban fraction and precipitation values at USGS streamgage:
05535200 NORTH BRANCH CHICAGO RIVER AT GLENVIEW, IL


| Water year | Segment | Discharge code | Cumulative reservoir storage (acre-feet) | Urban fraction | Precipitation (inches) | Observed peak discharge (ft3/s) | Adjusted peak discharge (ft3/s) | Exceedance probability |
| 1960 | 1 | -- | 0 | 0.442 | 0.432 | 786 | 1160 | 0.344 |
| 1961 | 1 | -- | 0 | 0.454 | 1.268 | 688 | 1030 | 0.464 |
| 1962 | 1 | -- | 0 | 0.465 | 0.233 | 674 | 998 | 0.491 |
| 1963 | 1 | -- | 0 | 0.477 | 1.252 | 532 | 807 | 0.687 |
| 1964 | 1 | -- | 0 | 0.488 | 0.798 | 532 | 798 | 0.698 |
| 1965 | 1 | -- | 0 | 0.500 | 0.521 | 458 | 700 | 0.791 |
| 1966 | 1 | -- | 0 | 0.511 | 0.486 | 616 | 880 | 0.609 |
| 1967 | 1 | -- | 0 | 0.523 | 1.411 | 1070 | 1400 | 0.187 |
| 1968 | 1 | -- | 0 | 0.535 | 0.799 | 519 | 747 | 0.749 |
| 1969 | 1 | -- | 0 | 0.546 | 1.912 | 866 | 1150 | 0.353 |
| 1970 | 0 | 2 | 961 | 0.558 | 1.715 | 730 | -- | -- |
| 1971 | 0 | -- | 961 | 0.564 | 0.351 | 608 | -- | -- |
| 1972 | 0 | -- | 961 | 0.570 | 2.064 | 998 | -- | -- |
| 1973 | 0 | -- | 1561 | 0.576 | 1.175 | 678 | -- | -- |
| 1974 | 0 | -- | 1561 | 0.582 | 1.220 | 755 | -- | -- |
| 1975 | 0 | -- | 1561 | 0.588 | 0.967 | 704 | -- | -- |
| 1976 | 0 | -- | 1561 | 0.594 | 1.310 | 1200 | -- | -- |
| 1977 | 0 | -- | 1561 | 0.600 | 0.751 | 319 | -- | -- |

